Journal by Dr Paul Batman P.hD
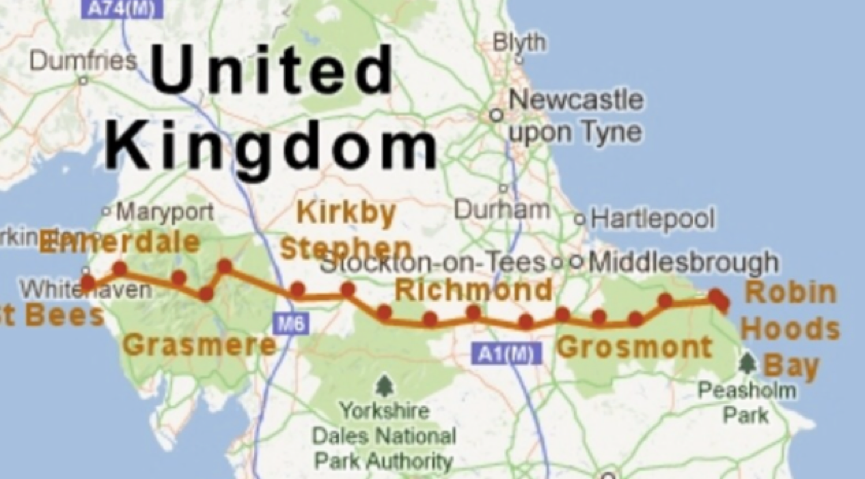
From St Bees in Cumbria to Robin Hoods Bay in Yorkshire
After 40 years of working and training in the fitness industry, I was recently diagnosed with a 90% blocked coronary artery. I was shattered, after teaching people for decades that if you were fit, ate a healthy diet, controlled your stress etc. there was a significantly reduced likelihood that you would suffer from cardiovascular diseases.
My experience forced to me to re-evaluate what I had been teaching for all those years. I embarked upon a journey of discovery researching information on oxidative stress, reactive oxygen species, tissue inflammation and CAD, atrial fibrillation, turbulent arterial blood flow, nitric oxide changes in exercise amongst other subjects in an attempt to answer why this was happening to me.
The results of this investigation were life changing for me. I cut back dramatically on my high intensity training and developed a movement program based around Non Exercise Activity Thermogenesis (NEAT). Typically NEAT is all the movements that we perform during the day outside of our 30-60 minutes fitness sessions.
I called this program “NEAT Fit”. Its aim is to reduce the barriers to exercise for the average person by converting daily inactive periods into meaningful active periods. This requires an assessment of the role of movement in their daily lives and a movement prescription based on MET minutes that create active homes, active work/retirement/unemployment, active transport and active leisure.
As part of my own personal active leisure changes, I ditched the lazy beach drinking holidays and began to take active holidays where I could move for most of the day. To this end I have been on cycling holidays, walking holidays and trekking holidays.
While I enjoyed trekking the Kokoda track in the Papuan New Guinea jungle and walking the Camino in France and Spain, I was really interested in walking across the North of England along the Coast to Coast route from St Bees in Cumbria to Robin Hoods Bay in Yorkshire that I had heard some much about.
I decided to undertake the walk in June 2018 and as a means of monitoring my progress and the degree of difficulty of the walk I decided to collect whatever data I could given the limitations of light pack and the need to carry whatever it contained. I used my Garmin tracker to track distances and my Fibion to measure energy expenditure and different degrees of intensity
I walked with a group of 11 people, 10 of whom were over 50 years with the youngest 40 and the oldest 70 years. We walked for 13 days and covered over 340 km without any rest days.
The following is a daily breakdown of distance covered, steps taken, energy expended, floors climbed, time walking and intensity levels (METs) of that journey.
Preliminary Information:
Distance covered: measured in kilometres over the course of the day.
Steps taken: measured over the course of the day.
Floors climbed: measured over the course of the day. One floor is reportedly equivalent to climbing 10 feet or 3 metres.
Energy expended: measured as kcals over the course of the day and includes daily resting energy expenditure.
Oxygen consumption: measured in METs over the daily distance of the walk, not the entire day. One (1) MET is equivalent to 3.5 mlO2/kg/min-1 and is equivalent to resting energy expenditure based on oxygen consumption. < 1.5 METs is resting or sedentary, 1.5-3 METs is classified as low intensity, 3-6 METs is classified as moderate intensity, while > 6 METs is classified as vigorous intensity.
Walking time: measured as hours and minutes for the duration of the walking day
Day 1: St Bees to Ennerdale Bridge
The Coast to coast walk typically is completed from West to East, starting at St Bees on the Irish Sea. The walk starts on the beach at St Bees and after picking up a pebble that will be thrown in the North Sea on journeys end as well as wetting your boots in the sea it begins along the coastal cliffs then inland over the hills of the Lakes district. The climb up Dent hills is the first tough physical test and then finishes with a long walk into Ennerdale Bridge.
Distance covered: 27 km
Steps walked: 42,142
Floors climbed: 100
Energy Expenditure: 4,305 kcals
Oxygen consumption: 3 hours 35 minutes > 6 METs (6 times resting energy expenditure) = >21 ml/kg/min-1
2 hours 25 minutes between 3.5 METs-6 METs (3.5 – 6 times resting energy expenditure) = 12.5 ml/kg/min-1– 21 ml/kg/min-1
12 minutes at < 3.5 METS (12.5 ml/kg/min-1 )(3.5 times resting energy expenditure)
Walking time: 6 hours 12 minutes
Day 2: Ennerdale Bridge to Borrowdale
Walk along the shores of Ennerdale waters and then along forest track to Black Sail hut. This is followed by a steep climb up the Lowther Beck and then across lake fells, reaching the decending path into the Honister Slate Mines and then to Borrowdale.
Distance covered: 26 km
Steps walked: 40,104
Floors climbed: 128
Energy Expenditure: 4,646 kcal
Oxygen consumption: 3hours 13 minutes > 6 METs (6 times resting energy expenditure) > 21 ml/kg/min-1
2 hour 39 minutes between 3.5 METs-6 METs (3.5 times- 6 times resting energy expenditure) = 12.5 ml/kg/mim-1 –21 ml/kg/min-1
40 minutes at < 3.5 METS (12.5 ml/kg/min-1 )(3.5 times resting energy expenditure)
Walking time: 6 hours 32 minutes
Day 3: Borrowdale to Grasmere
Walk along the lakes across the ridges and descending into into Grasmere.
Distance covered: 23 km
Steps walked: 32,345
Floors climbed: 104
Energy Expenditure: 4,429 kcal
Oxygen consumption: 2 hours 43 minutes > 6 METs (6 times resting energy expenditure) > 21 ml/kg/min-1
3 hours 28 minutes between 3.5 METs-6 METs (between 3.5 – 6 times resting energy expenditure) = 12.5 ml/kg/min-1 – 21 ml/kg/min-1
23 minutes at < 3.5 METS (12.5 ml/kg/min-1 )(3.5 times resting energy expenditure)
Walking time: 6 hours 34 minutes
Day 4: Grassmere to Patterdale
Walk over Grisedale pass (2,000 ft) around the lake and into Patterdale.
Distance covered: 14 km
Steps walked: 19,368
Floors climbed: 99
Total Daily Energy Expenditure: 3,553 kcal
Oxygen consumption: 1 hours 57 minutes > 6 METs (6 times resting energy expenditure) > 21 ml/kg/min-1
2 hours 31 minutes between 3.5 METs- 6 METs (3.5 – 6 times resting energy expenditure) = 12.5 ml/kg/min-1– 21 ml/kg/min-1
38 minutes at < 3.5 METS (12.5 ml/kg/min-1 )(3.5 times resting energy expenditure)
Walking time: 5 hours 6 minutes
Day 5 Patterdale to Shap
A demanding day starting with a steep climb past Angle Tarn and then continue upwards to Kirsty peak (2,560 ft) the highest point in the walk and then a descent into Haweswater and then a gentler walk into Shap. This is the most easterly point of the Lakes district.
Distance covered: 24.15kms
Steps walked: 33,500
Floors climbed: 286
Energy Expenditure: 4,882 kcal
Oxygen consumption: 3 hours 25 minutes > 6 METs (6 times resting energy expenditure) > 21 ml/kg/min-1
2 hours 50 minutes between 3.5 METs- 6 METs (3.5 – 6 times resting energy expenditure) = 12.5 ml/kg/min-1– 21 ml/kg/min-1
40 minutes at < 3.5 METS (12.5 ml/kg/min-1 )(3.5 times resting energy expenditure)
Walking time: 6 hours 55 minutes
Day 6: Shap to Kirkby Stephen
Walking between Cumbria and the Yorkshire Dales there is a hilly section across the Limestone Moors. There are many ascents and descents around Smartdale Ridge and then into Kirkby Stephen.
Distance covered: 33.71 kms
Steps walked: 46,755
Floors climbed: 129
Energy Expenditure: 5,525 kcals
Oxygen consumption: 5 hours 42 minutes > 6 METs (6 times resting energy expenditure) > 21 ml/kg/min-1
1 hours 34 minutes between 3.5- 6 METs (3.5- 6 times resting energy expenditure) = 12.5 ml/kg/min-1– 21 ml/kg/min-1
20 minutes at < 3.5 METs (12.5 ml/kg/min-1 )(3.5 times resting energy expenditure)
Walking time: 7 hours 36 minutes
Day 7 Kirkby Stephen to Keld
Climb out of Kirkby Stephen to the Nine Standards (2,170 ft) then across the muddy Moors and down into Keld.
Distance covered: 24 km
Steps walked: 33,150
Floors climbed: 137
Energy Expenditure: 4,352 kcal
Oxygen consumption: 2 hours 54 minutes > 6 METs (6 times resting energy expenditure) > 21 ml/kg/min-1
3 hours 26 minutes between 3.5 – 6 METs (3.5- 6 times resting energy expenditure) = 12.5 ml/kg/min-1– 21 ml/kg/min-1
28 minutes at < 3.5 METS (12.5 ml/kg/min-1 )(3.5 times resting energy expenditure)
Walking time: 6 hours 48 minutes
Day 8 Keld to Reeth
We took the higher alternative over the windy moorland and through the lead mines
Distance covered: 25.3 km
Steps walked: 34,198
Floors climbed: 135
Energy Expenditure: 4,952 kcal
Oxygen consumption: 4 hours 10 minutes > 6 METs (6 times resting energy expenditure) > 21 ml/kg/min-1
1 hours 50 minutes between 3.5 – 6 METs (3.5- 6 times resting energy expenditure) = 12.5 ml/kg/min-1– 21 ml/kg/min-1
23 minutes at < 3.5 METS (12.5 ml/kg/min-1 ) (3.5 times resting energy expenditure)
Walking time: 6 hours 23 minutes
Day 9 Reeth to Richmond
Walk through Swaledale and into Richmond.
Distance covered: 22.3 km
Steps walked: 30,837
Floors climbed: 104
Energy Expenditure: 4,484 kcal
Oxygen consumption: 3 hours 51 minutes > 6 METs (6 times resting energy expenditure) > 21 ml/kg/min-1
1 hours 34 minutes between 3.5 – 6 METs (3.5- 6 times resting energy expenditure) = 12.5 ml/kg/min-1– 21 ml/kg/min-1
35 minutes at < 3.5 METS (12.5 ml/kg/min-1 )(3.5 times resting energy expenditure)
Walking time: 6 hours
Day 10 Richmond to Osmotherley
This is the longest and flattest day of the walk bringing together the Yorkshire Dales and the North York Moors National Park.
Distance covered: 39.40 km
Steps walked: 54,654
Floors climbed: 63
Energy Expenditure: 6,202 kcal
Oxygen consumption: 6 hours 20 minutes > 6 METs (6 times resting energy expenditure) > 21 ml/kg/min-1
1 hours 11 minutes between 3.5- 6 METs (3.5- 6 times resting energy expenditure) = 12.5 ml/kg/min-1 – 21 ml/kg/min-1
18 minutes at < 3.5 METS (12.5 ml/kg/min-1 )(3.5 times resting energy expenditure)
Walking time: 7 hours 49 minutes
Day 11 Osmotherley to Blakely
A demanding day with many ascents and descents in the Cleveland hills then across the moors to Rosedale and then up to Claybank Top followed by a long flat walk to Blakely.
Distance covered: 32.07 km
Steps walked: 44,470
Floors climbed: 196
Energy Expenditure: 5,965 kcal
Oxygen consumption: 5 hours 37 minutes > 6 METs (6 times resting energy expenditure) > 21 ml/kg/min-1
1 hours 37 minutes between 3.5- 6 METs (3.5- 6 times resting energy expenditure) = 12.5 ml/kg/min-1– 21 ml/kg/min-1
12 minutes at < 3.5 METS (12.5 ml/kg/min-1 ) (3.5 times resting energy expenditure)
Walking time: 7 hours 26 minutes
Day 12 Blakely to Egton Bridge
Walk on the road past Fat Betty and then undulating descent down into Eskdale, along the river Esk and into Egton Bridge.
Distance covered: 21.5 km
Steps walked: 29,910
Floors climbed: 33
Energy Expenditure: 4,264 kcal
Oxygen consumption: 4 hours 2 minutes > 6 METs (6 times resting energy expenditure) > 21 ml/kg/min-1
46 minutes between 3.5 – 6 METs (3.5- 6 times resting energy expenditure) = 12.5 ml/kg/min-1 – 21 ml/kg/min-1
20 minutes at < 3.5 METS (12.5 ml/kg/min-1 )(3.5 times resting energy expenditure)
Walking time: 5 hours 8 minutes
Day 13 Egton Bridge to Robin Hoods Bay
Walk along roads up the moors looking down to Whitby. From the high moors, the last 5 km is along the coastal track to Robin Hoods Bay.
Distance covered: 28.39 km
Steps walked: 39,380
Floors climbed: 175
Energy Expenditure: 4,855 kcals
Oxygen consumption: 3 hours 13 minutes > 6 METs (6 times resting energy expenditure) > 21 ml/kg/min-1
2 hours 35 minutes between 3.5 – 6 METs (3.5- 6 times resting energy expenditure) = 12.5 ml/kg/min-1 – 21 ml/kg/min-1
16 minutes at < 3.5 METS (12.5 ml/kg/min-1) = 12 (3.5 times resting energy expenditure)
Walking time: 6 hours 4 minutes
Data Summary from the “Coast to Coast” Walk
Distance Covered: 340.82 km
Average daily distance covered: 26.2 km
Total walking time: 84 hours 11 minutes
Average walking time per day: 6 hours 25 minutes at a daily average speed of 4 km per hour.
Steps taken: 480,813
Average daily steps: 36,985
Energy expended: 62,814 kcal
Average daily energy expenditure: 4,831 kcal
Floors climbed: 1,639
Average daily floors climbed: 126
Time spent at > 6 METs (> 21 ml/kg/min-1)is 51 hours 39 minutes (vigorous intensity)
Average daily time > 6 METs is 3 hours 58 minutes
Average daily MET Minutes > 6 METs is 1,428 MET Minutes
Time spent between 3.5 – 6 METs (12.5 ml/kg/min-1 – 21 ml/kg/min-1) is 27 hours 07 minutes (moderate intensity)
Average daily time spent between 3.5- 6 METs is 2 hours and 5 minutes
Average daily MET Minutes between 3.5 METs – 6 METs is 437-750 MET Minutes
Time spent < 3.5 METs (<12.5 ml/kg/min-1): 5 hours 25 minutes (low intensity)
Average daily time < 3.5 METs = 25 minutes per day
Average daily MET Minutes < 3.5 METs = 87 MET Minutes
*** For health benefits the World Health Organisation (WHO) recommends a minimum of 150 minutes of moderate intensity activity per week (5 days) at an intensity of 4 METs = 600 MET Minutes or 75 minutes of vigorous intensity activity per week (5 days) at 6 METs = 450 MET minutes.
Average daily MET minutes based on the WHO recommendations at a moderate intensity = 120 MET Minutes.
Average daily MET Minutes based on the WHO recommendation at a vigorous intensity = 90 MET Minutes.
The daily MET minutes for moderate intensity on the Coast to Coast was between 437-750 MET Minutes, which is 3-8 times the WHO daily recommendations.
The daily MET minutes for vigorous intensity on the Coast to Coast was 1,428 MET Minutes, which is over 15 times the WHO daily recommendations of 90 MET Minutes!!